Reproduce, isolate, diagnose
A 5-step workflow that turns "it does not work" into a 30-minute fix path. Same steps across every language.
How-To
A repeatable 5-step process for finding bugs in C, C++, Java, Python, and JavaScript. With actual GDB session output, a Valgrind trace, and a pytest reproduction template.
Overview
At a glance
A 5-step workflow that turns "it does not work" into a 30-minute fix path. Same steps across every language.
Per-language toolchain. Actual GDB session output, a Valgrind leak trace, a pytest reproduction template.
Form a hypothesis before changing code. Test it. Random edits without hypotheses turn 30-minute fixes into 3-hour sessions.
Section 1 of 13
A bug you cannot reproduce is a bug you cannot fix. The first 10 minutes go to building the smallest input that triggers the failure 100% of the time. Without deterministic reproduction, you are guessing.
Start with the failing input. Cut it in half: does the failure persist? Repeat until further reduction makes the bug disappear. The remaining input is your minimal failing case. This is delta debugging, formalized by Andreas Zeller, and works on inputs, configurations, and even commit history (git bisect is delta debugging on commits).
Record the language version, compiler version, OS, and library versions. Bugs that reproduce on macOS but not Linux are usually pointer-size or alignment issues. Bugs that reproduce on Python 3.10 but not 3.11 are usually behavioral changes in CPython internals (dict ordering, error message format, asyncio defaults).
If the failure involves randomness (shuffled input, random sampling, fuzzing), capture the seed. random.seed(42) in Python, Math.seedrandom(42) in JavaScript with the seedrandom package, srand(42) in C. Without a seed, every retest is a new dice roll.
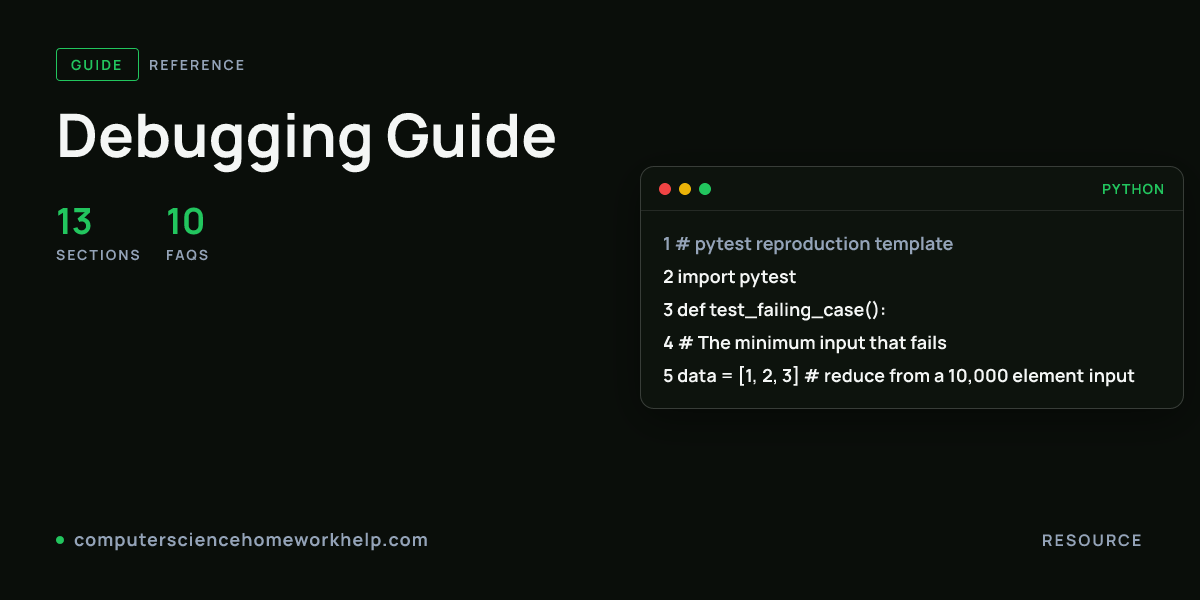
# pytest reproduction template
import pytest

def test_failing_case():
    # The minimum input that fails
    data = [1, 2, 3]   # reduce from a 10,000 element input
    result = process(data)
    assert result == [3, 2, 1], f"got {result}"

# Run only this test: pytest -k test_failing_case -v
# Run with seed: PYTHONHASHSEED=42 pytest -k test_failing_case# git bisect to find the breaking commit
git bisect start
git bisect bad # current HEAD fails
git bisect good <sha> # this older commit passed
# git runs binary search; for each commit:
# build, run failing test, type 'good' or 'bad'
# at the end git reports the commit that introduced the bug
git bisect reset # cleanupSection 2 of 13
With a deterministic repro in hand, narrow the bug to a single function, class, or module. Bisect the code path: comment out half the work, does the bug persist? If yes, the bug is in the surviving half. Repeat. Equivalently, insert print or log statements at function boundaries and inspect which crossing produces wrong values.
Place 5 prints: at the function entry, at the function exit, and at 3 key decision points inside. Compare expected vs actual at each. The first divergence is the bug location. Do not place 50 prints; you drown in output.
Form a hypothesis before changing code. "I think the bug is in line 47 because the loop should run n+1 times but runs n times." Test the hypothesis. If wrong, form a new one. Random edits without hypotheses turn a 30-minute fix into a 3-hour shotgun debugging session that breaks neighboring code.
# Strategic print placement
def compute_average(nums):
    print(f"[entry] nums={nums!r}")
    if not nums:
        print(f"[branch] empty input, returning 0")
        return 0
    total = sum(nums)
    print(f"[checkpoint] total={total}")
    avg = total / len(nums)
    print(f"[exit] avg={avg}")
    return avg

# Or use the logging module for production
import logging
logging.basicConfig(level=logging.DEBUG)
log = logging.getLogger(__name__)
log.debug("entry: nums=%r", nums)
Section 3 of 13
Once isolated to a small region, attach a debugger or analyzer. The tool depends on the language and bug class.
GDB sets breakpoints, inspects variables, walks the stack. Valgrind instruments memory accesses to detect leaks, use-after-free, uninitialized reads, double frees. AddressSanitizer (-fsanitize=address) is a faster alternative for the same memory bugs, with a 2x slowdown vs Valgrind 20x.
jdb ships with the JDK; jdb -attach localhost:5005 against a process launched with -agentlib:jdwp=transport=dt_socket,server=y,suspend=n,address=5005. IDEs (IntelliJ, Eclipse) wrap this in a GUI. JProfiler and async-profiler attribute CPU time to methods for performance bugs.
import pdb; pdb.set_trace() drops the interpreter into the debugger at that line. Python 3.7+ breakpoint() is the modern equivalent. pytest --pdb drops into pdb on the first failure, so you inspect the live frame instead of guessing from a stack trace.
Browser code: open DevTools (Cmd+Opt+I on macOS, F12 on Windows), Sources tab, click the line number to set a breakpoint, reload. Node code: node --inspect-brk script.js opens a debugger socket; visit chrome://inspect in Chrome and click "Open dedicated DevTools for Node".
# Real GDB session on a segfaulting program
$ gcc -g -O0 main.c -o app
$ gdb ./app
(gdb) run
Starting program: /tmp/app
Program received signal SIGSEGV, Segmentation fault.
0x000055555555516d in compute (n=10) at main.c:7
7           buf[i] = i * 2;
(gdb) bt
#0  0x000055555555516d in compute (n=10) at main.c:7
#1  0x00005555555551a9 in main () at main.c:14
(gdb) print i
$1 = 1000000
(gdb) print n
$2 = 10
# Bug: loop variable i hit 1000000 when n=10; off-by-one in
# the loop condition.# Valgrind output for a use-after-free bug
$ valgrind --leak-check=full ./app
==12345== Memcheck, a memory error detector
==12345== Invalid read of size 4
==12345== at 0x40118A: main (main.c:9)
==12345== Address 0x4a4d040 is 0 bytes inside a block of size 40 free'd
==12345== at 0x484288F: free (vg_replace_malloc.c:872)
==12345== by 0x40117B: main (main.c:8)
==12345== Block was alloc'd at
==12345== at 0x4848899: malloc (vg_replace_malloc.c:381)
==12345== by 0x40115F: main (main.c:5)
# Read after the block was freed at line 8; bug is on line 9.# pdb interactive session
def buggy(n):
breakpoint() # Python 3.7+ drops into pdb here
total = 0
for i in range(n):
total += i * 2
return total
# Commands at the (Pdb) prompt:
# n next line
# s step into function call
# c continue to next breakpoint
# p x print variable x
# pp x pretty-print x
# l list source around current line
# bt backtrace
# q quit// Node --inspect-brk debugging
// 1. Launch: node --inspect-brk script.js
// 2. Open chrome://inspect, click "inspect"
// 3. DevTools opens paused on the first line
// 4. Set breakpoints by clicking line numbers in Sources
// Or use built-in debugger statement (don't ship to production)
function compute(n) {
debugger; // browser/Node debugger pauses here
return n * 2;
}Section 4 of 13
The fix should be the smallest change that resolves the bug and does not introduce new ones. Resist the urge to refactor neighboring code; that is a separate commit. Two patches in one PR cost twice as long to review and triple the risk of regression.
If the spec is wrong, the fix is to clarify the spec, not to patch the code. Patching wrong-spec code creates technical debt and breaks the next person who reads the spec and expects the code to follow it.
Section 5 of 13
Re-run the failing case from Step 1. If it passes, run the full test suite to confirm no regression elsewhere. Then write a new test that locks the fix in. The test should fail without the fix and pass with it. Without the regression test, the bug will return in 6 months when someone refactors the area.
# pytest regression test for a real bug
import pytest

def divide(a, b):
    if b == 0: return None  # the fix: guard against zero
    return a / b

def test_divide_by_zero_returns_none():
    # Regression: divide(1, 0) raised ZeroDivisionError before fix
    assert divide(1, 0) is None

def test_divide_normal():
    assert divide(10, 2) == 5.0

# Run: pytest test_divide.py -v
# Add to CI so the bug cannot return silently.// JUnit 5 regression test
import org.junit.jupiter.api.Test;
import static org.junit.jupiter.api.Assertions.*;
class DivideTest {
@Test
void divideByZeroReturnsZero() {
// Regression: divide(1, 0) threw ArithmeticException before fix
assertEquals(0.0, MathOps.divide(1, 0));
}
@Test
void divideNormal() {
assertEquals(5.0, MathOps.divide(10, 2));
}
}Section 6 of 13
Pattern recognition speeds up the diagnose step. After 100 bugs, you learn the symptoms; until then, this lookup works.
| Symptom | Likely cause | Tool |
|---|---|---|
| Segfault | NULL deref, out-of-bounds, freed pointer | GDB, Valgrind, AddressSanitizer |
| NullPointerException | Uninitialized field, missing null check, lazy init returning null | Java 14+ helpful NPE, jdb |
| IndexError / ArrayIndexOutOfBoundsException | Off-by-one, empty container, negative index | pdb, IntelliJ debugger |
| Memory leak | Allocation without free, unbounded cache, circular references | Valgrind, JProfiler, heapdump |
| Infinite loop | Loop variable never updated, wrong termination condition | Ctrl+C in pdb, gdb attach |
| Wrong answer, no crash | Logic bug, type coercion, integer overflow | Unit tests, property-based tests |
| Intermittent failure | Race condition, uninitialized memory, dependency on iteration order | ThreadSanitizer, repeat 1000x |
| Compiles but does not link | Missing object file, missing -l flag, mismatched signature | Read linker output |
| Test passes locally, fails on CI | Hidden env dep, race, time zone, locale, dictionary iteration order | Run in CI-equivalent container |
Section 7 of 13
Sunk-cost fallacy traps every CS student. After 90 minutes on a single bug with no progress, ask for help. Quality of help correlates with quality of question.
A bug report that includes all 5 elements gets a 5-minute answer. A bug report that says "my code does not work, can someone help" gets either ignored or a 30-message back-and-forth to extract the same information. Submitting an assignment to CSHH with the 5 elements above gets a working solution within the 12-hour turnaround; without them, a tutor will have to ask for them first.
Section 8 of 13
Future-you debugs production. Logging is for future-you. The 4-level convention (DEBUG, INFO, WARN, ERROR) maps to who reads each level: DEBUG is for the original author tracing a specific bug, INFO is for the operator monitoring normal flow, WARN is for the on-call engineer who needs to investigate, ERROR is for the alerting system that pages someone.
Structured logs (JSON with named fields) are queryable by every log aggregator (Splunk, Datadog, ELK). String logs ("User 42 did action foo at 2026-05-27") require regex parsing on the read path. Pick the structured format on day 1; converting later is a project.
# Python structured logging with stdlib
import logging
import json

class JsonFormatter(logging.Formatter):
    def format(self, record):
        return json.dumps({
            'time': self.formatTime(record),
            'level': record.levelname,
            'logger': record.name,
            'msg': record.getMessage(),
            'request_id': getattr(record, 'request_id', None),
        })

handler = logging.StreamHandler()
handler.setFormatter(JsonFormatter())
log = logging.getLogger('app')
log.addHandler(handler)
log.setLevel(logging.INFO)

# Usage: pass request_id via extra={}
log.info('processed upload', extra={'request_id': 'req-abc-123'})
# {"time": "2026-05-27 12:30:45", "level": "INFO", ...}// Java SLF4J + Logback with MDC for request context
import org.slf4j.Logger;
import org.slf4j.LoggerFactory;
import org.slf4j.MDC;
public class UploadHandler {
private static final Logger log = LoggerFactory.getLogger(UploadHandler.class);
public void handle(String requestId, byte[] body) {
MDC.put("requestId", requestId);
try {
log.info("upload start, size={}", body.length);
// process the body
log.info("upload end, status=200");
} catch (Exception e) {
log.error("upload failed", e);
} finally {
MDC.clear();
}
}
}Section 9 of 13
When a feature worked last week and breaks today, git bisect performs binary search over commits to identify the breaking one. The workflow takes 6 commits to bisect 100 commits, 10 commits to bisect 1000 commits. Without bisect, you read every commit serially: O(n) effort vs O(log n).
git bisect startgit bisect bad (HEAD is broken)git bisect good <sha> (a known-good commit, often last release tag)git bisect good or git bisect bad.git bisect reset to return to the original HEAD.Replace the manual "build and run test" step with a script that exits 0 for good and 1 for bad. git bisect run ./test.sh runs the bisect autonomously. A 1000-commit bisect that would take 30 minutes by hand takes 10 minutes unattended. The same workflow scales to commits in different repos via submodules and to multi-day historical bisects when paired with reproducible Docker build environments.
Section 10 of 13
A student's C program processes a CSV file. Works on a 100-row test, crashes on the 10,000-row production input. Step 1 reproduce: confirm the crash on the full file, save the file. Step 2 isolate: cut to row 1 through 5,000 (still crashes), row 1 through 2,500 (does not crash), row 2,500 through 5,000 (crashes). Bug is somewhere in rows 2,500 through 5,000. Binary search again: rows 3,200 through 3,400 trigger it. Single row 3,357 trigger it. Step 3 diagnose under Valgrind: "Invalid write of size 4 at parse_row main.c:42". The row has 256 characters; the fixed-size buffer is 200. Step 4 fix: replace fixed buffer with malloc sized to strlen(line)+1. Step 5 verify: add a test that feeds a 1000-character row.
A student's Java solution passes 18 of 20 local tests but only 12 of 20 on Gradescope. Step 1 reproduce: download the Gradescope test harness, run locally. Still fails the same 8 tests. Step 2 isolate: the 8 failing tests all involve iteration over a HashMap. The 12 passing tests use other structures. Step 3 diagnose: HashMap iteration order is unspecified; the local JVM happens to produce the expected order, Gradescope's JVM does not. Step 4 fix: switch to LinkedHashMap (insertion-order) or sort before output. Step 5 verify: rerun the harness 10 times to confirm determinism.
A student's Python script processes log files, OOM-kills around the 50,000th line. Step 1 reproduce: confirm OOM with a synthetic log file. Step 2 isolate: memory_profiler (pip install memory-profiler, @profile decorator) shows memory grows linearly with line count. Step 3 diagnose: the script reads the whole file into a list with lines = f.readlines(), then processes each line. Step 4 fix: stream with for line in f: which yields one line at a time. Step 5 verify: rerun on the full input, memory stays under 50 MB.
Section 11 of 13
Single-process debugging tools fall down when the bug spans multiple processes, machines, or async boundaries. Three patterns cover most multi-process coursework (xv6 OS labs, distributed key-value stores, MapReduce assignments).
Record every input (network message, file read, syscall return) on the first run. Replay the recording in a debugger to reproduce the bug deterministically. rr (Mozilla's record-and-replay debugger) does this for Linux processes; Hermit from Meta does it for arbitrary processes; Replay.io does it for browser JavaScript. Without replay, intermittent multi-process bugs are guesswork.
Each request carries a unique trace ID through every service. Logs and metrics tag the trace ID. Querying the trace ID across all logs reconstructs the full request path. OpenTelemetry is the standard instrumentation API; Jaeger and Tempo are open-source backends. For coursework, a simple request_id = uuid4() propagated through function arguments achieves the same result without infrastructure.
Inject failures deliberately (drop packets, delay messages, kill nodes) and verify the system recovers. Jepsen tests reveal consistency bugs in distributed databases that no other tooling catches. For coursework, a randomized test driver that simulates partition and recovery on every other iteration finds 10x more bugs than tests that exercise the happy path.
Section 12 of 13
Four debugger session shapes cover 90% of coursework bugs.
Set a breakpoint where the variable is read. Run. Print the variable. Print the call stack to understand how the function was reached. Most useful debugger command: p var.
Set a watchpoint on the variable. Run. The debugger pauses at every write. Inspect the value and the caller until you find the offending write. Most useful debugger command: watch var.
Attach the debugger to the running process (gdb -p <pid>, jstack <pid>, py-spy dump --pid <pid>). Print every thread's stack. The thread holding the contended lock or spinning in the busy loop is visible at the top frame. Most useful command: info threads then thread N then bt.
Run under the debugger. The assert traps into the debugger automatically. Walk the stack and print locals at each frame to reconstruct the state that violated the invariant. Most useful command: frame N then info locals.
Section 13 of 13
-fsanitize=address compile flag. 2x slowdown, smaller heap overhead. Built into GCC and Clang.-fsanitize=undefined. Catches signed overflow, null deref, OOB at runtime.More Resources
Time and space complexity for every common data structure and algorithm. Same operation shown across Java, Python, C++, and JavaScript so you can compare directly.
Open Big-O Cheatsheet40 errors across 5 languages, every one paired with the verbatim compiler output, root cause, and the Broken vs Fixed snippet that resolves it.
Open Common Compiler ErrorsJava, Python, C++, JavaScript, C, and Assembly compared across 7 axes that matter for coursework. With autograder-compatibility notes per language.
Open Language ComparisonFAQ
-fsanitize=thread. Uninitialized memory: a stack variable that happens to be zero on your machine but garbage elsewhere. Run under -fsanitize=memory. Iteration order dependence: HashMap in Java and HashSet in C++ have unspecified iteration order. Switch to LinkedHashMap or sort.watch x to pause on any change, watch -l x for the memory location.kill -SIGABRT $(pidof app) with -g compiled in dumps core; open with gdb ./app core, bt for backtrace. For Java: jstack <pid> prints every thread's stack. For Python: send SIGINT (Ctrl+C in interactive, kill -INT $(pgrep -f script.py)), the resulting KeyboardInterrupt traceback shows where the process was stuck.gdb -p <pid> attaches to a running process. The kernel's ptrace_scope setting on modern Linux blocks attaching to non-child processes unless you set kernel.yama.ptrace_scope=0 or run gdb as root. For Java, launch the JVM with -agentlib:jdwp=...,server=y,suspend=n,address=5005, then jdb -attach localhost:5005. For Node: launch with --inspect instead of --inspect-brk; the running process accepts a debugger connection without pausing.break main.c:42 if i == 9999 pauses only on the 9,999th iteration. Both beat the cycle of "run for 5 minutes, hit the bug, restart, run for 5 minutes".Cross-linked
Cheatsheets and guides cover the general ground. For your specific brief, submit it and get expert pedagogical help within 12 hours.
Submit Assignment